


Business intelligence & data engineering
Dashboards worth opening, and the pipelines underneath that keep them true.
The challenge
Five versions of every number
Finance has one revenue figure, sales another, the board pack a third — and month-end becomes an argument about whose spreadsheet is right. Every new dashboard adds speed to the chaos, not clarity: more extracts, more definitions, more numbers that almost match. The problem is rarely the reporting tool. It's that there is no single, governed place where the business agrees what its numbers mean.
Our approach
Build the platform under the dashboards
We put one governed data platform under the whole business — sources reconciled, metrics defined once, access controlled — and build the reporting on top of it. Finance, ops and the board read the same number, and every figure walks back to its source. The same platform carries reporting today, and data science and AI tomorrow — one foundation instead of three systems feeding each other.
Results
Decisions made off one set of numbers
Less time in spreadsheet-vs-spreadsheet arguments, a faster month-end, and reporting that stands up to auditor and regulator without a scramble.
What we do
Single definition of revenue, customer, asset, event — across brands, subsidiaries and source systems.
- One definition of revenue, customer, asset — agreed once, enforced everywhere
- Source systems mapped and reconciled; discrepancies surfaced instead of debated
- Changes to definitions versioned and visible
Auditable monthly packs, daily refresh on critical numbers, exception highlighting. Numbers that hold up.
- Auditable monthly packs assembled from the governed layer, not from mailbox Excel
- Daily refresh on critical numbers, exception highlighting built in
- Every figure traceable to source
Live views for the people running the day — stock, queues, sales, incidents — interactive enough to answer the follow-up question without a ticket to BI.
- Live views of stock, queues, sales and incidents for the people running the day
- Interactive to the follow-up question — drill down without a ticket to BI
- Role-based views, so each team sees its own operation
Curated datasets, governed measures, training pathways. Lets analysts build without breaking the model.
- Curated datasets and governed measures analysts can build on without breaking the model
- Training pathways, so self-service doesn't mean self-taught
- Guardrails catch rogue metrics before they spread
Customer-facing analytics inside SaaS products, with row-level security and multi-tenant isolation.
- Customer-facing analytics inside your product, on the same governed foundation
- Row-level security and multi-tenant isolation as design principles, not patches
- Usage measured, so you know which insights customers actually value
Who owns each metric, what it means, who may see it, and how quality is enforced — the rules that make every number defensible, without slowing the teams who use it.
- Ownership, meaning and access rules per metric — written down and enforced by the platform
- Data quality measured against SLAs, with alerts before the board notices
- Designed to enable teams, not to slow them down
Bronze / Silver / Gold layers, governance baked in, semantic layer on top. The auditor can walk a Gold figure back to a Bronze event.
- Bronze / Silver / Gold layers with governance baked in from the first pipeline
- Semantic layer on top, so business tools speak business language
- Built on the engine that fits your stack
Shared infrastructure, tenant-specific transformations, group-level governance. Reusable across portfolio companies.
- Shared infrastructure with tenant-specific transformations per company
- Group-level governance over local flexibility
- Onboarding a new portfolio company is configuration, not a new project
Event-level data for audience, sensor, transaction and fraud-style use cases. Backpressure-aware, replayable.
- Event-level pipelines for audience, sensor, transaction and fraud-style use cases
- Backpressure-aware and replayable — a bad hour can be rerun, not lost
- Latency tuned to the decision it feeds: real-time where it pays, batch where it doesn't
Reports and models moved from Tableau, SSRS and SSAS onto Power BI — logic preserved, definitions carried into the governed model, and users landing on one platform instead of three.
- Reports and models moved from Tableau, SSRS and SSAS with logic preserved
- Definitions carried into the governed model, not re-invented
- Users trained and landed on one platform; the old estate retired on a plan
Proven in production

Data
Arnarlax — Iceland's largest farmer and producer of Atlantic salmon
Iceland's largest Atlantic salmon producer replaced its source systems and its data platform at once — migrated to Microsoft Fabric without the business losing a reporting week.

Web & Mobile
Netgíró — Iceland's national payment method
Iceland's leading buy now, pay later platform — built and scaled over more than a decade of partnership.
AI & Data
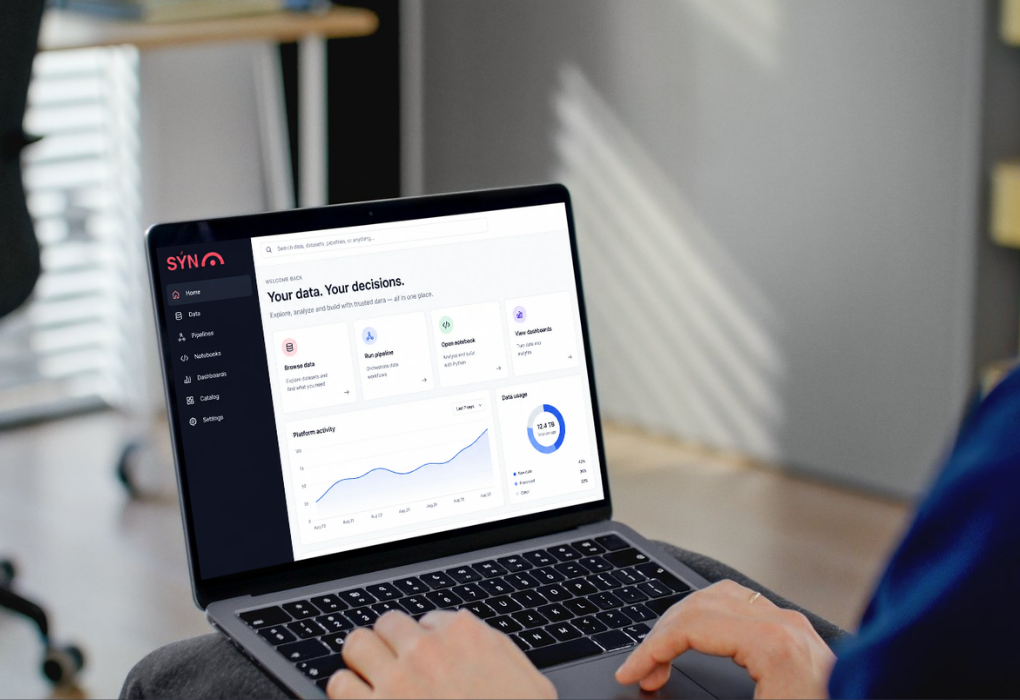
Sýn — An AI-native data platform
Iceland's telco and media group replaced a legacy warehouse estate with a self-running Databricks lakehouse — AI on both sides of the platform, and roughly half the run-rate.